Coordinate Grids
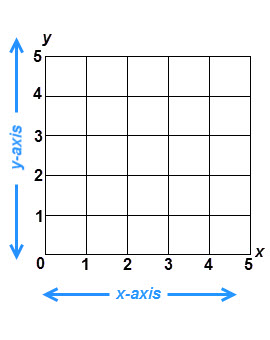
A coordinate grid is a plane or flat surface that has an x-axis and a y-axis. The x-axis runs horizontally and the y-axis runs vertically. Each axis is divided into lines that measure units away from the x- or y-axis. Sometimes coordinate planes use numbers on their axes and sometimes they use letters.
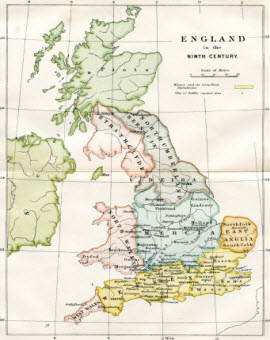
Coordinate grids are used in many different ways. Maps use coordinate grids to organize information. Mathematicians use coordinate grids to plot points and solve problems. City planners use coordinate grids when they carry out large building projects. The Global Positioning Satellite, or GPS, software in a cell phone or a car uses a coordinate grid to identify your location in the world.
(This is a map of England in the Ninth Century.)
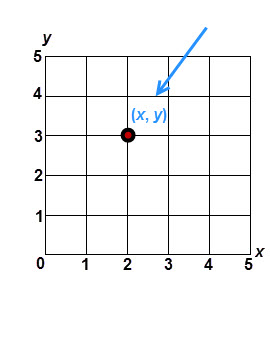
You can plot a point on a coordinate grid by knowing its x and y numbers, or values. These are listed with the x-value first and the y-value second.
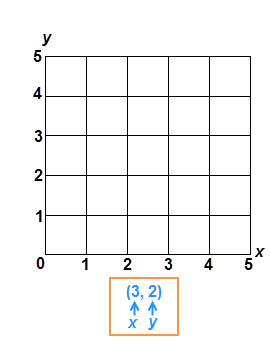
For example, let’s say we wanted to plot the coordinate (3, 2). In this case, the x-value is 3 and the y-value is 2.
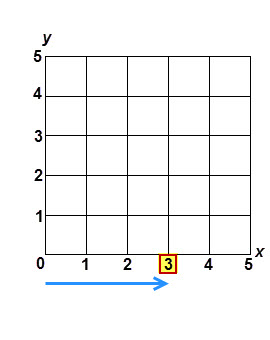
Start with the x-value. It is 3, so find the number 3 on the x-axis. Remember, the x-axis runs horizontally.
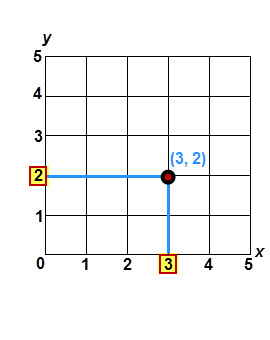
Now find the y-value. It is 2, so find the number 2 on the y-axis. Now follow the lines for the x number and the y number until they intersect, or cross. This is the coordinate (3, 2).
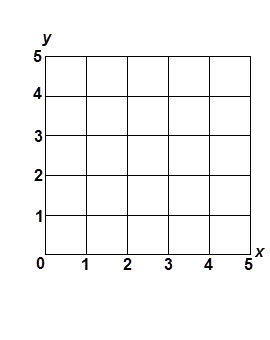
Now try finding the coordinate (1, 3). Remember that you need to find both the x and y numbers and follow their lines until they intersect.
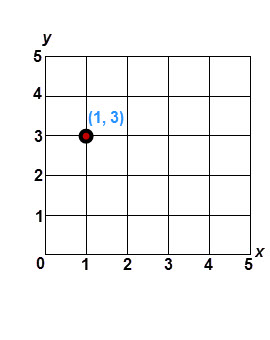
Did you find it? As you can see, the point is at the intersection of an x-value of 1 and a y-value of 3.

Knowing how to use a coordinate grid will help you plan and build your settlement wisely.
(This photograph shows a real-life reproduction of a colonial settlement in Plymouth, Massachusetts.)